1) Enable Tableau Embedding
- Open your SQL table in Tableau Desktop and create or open a sheet in Tableau as usual.
Your View needs to be using the same data source as your superset table.
For this example I will make a simple view using my sample data, then walk you step-by-step through the process of embedding the Editable Table.
- Once your view is in place, you should decide on a parameters you will use to connect to your Editable Chart. If you are not using a give unique row ID, that is. When marking a location on your graph, by which parameters can that point be uniquely identified? This example uses a combination of Date and Segment.
- When in your chart, on the bottom left, in the Measures section: right-click and choose Create > Create Parameter.
Give your parameter a name and choose its data type. Repeat until you have all your parameters in place.
- Add your view to a Dashboard.
- Display your parameters in the sheet by the clicking More Options > Parameters and selecting your parameters.
They will now be displayed in your dashboard.
You don’t have to keep them there, but it will be handy when making sure everything is working correctly.
- In the top-bar of your Tableau go to Dashboard > Actions…. From here, hit Add Actions > Change Parameter.
Give your action a name and select the dashboard and sheet you are working with.
The Parameter is the parameter you created in the last step, the Value Field is the Column it refers to in your data.
In this example it is Date > date, and Segment > segment.
NOTE: This option is only available in Tableau Desktop.
Make sure that when you click a point in your chart, your parameter(s) change to the correct values.
2) Preparing the Extension File
In order to embed a Superset chart into your Tableau dashboard, it is necessary to create an extension file for Tableau. For that, you will need the ID of your superset chart and put it into the “.trex” (Tableau extension) file.
- Go to app.pushmetrics.io/chart/list. Right-click the name of your chart, choose 'Copy Link Address'.
- Download the “.trex” file here.
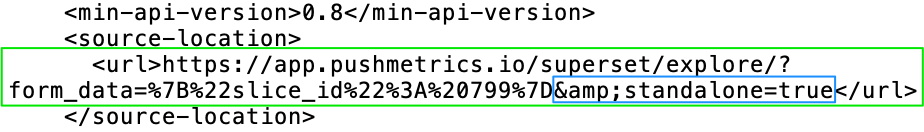
- Open the file in a text editor. Identify the URL tag and replace it with your Link Adress. Add the following bit to your Link:
&standalone=true
- Back in Tableau, double-click or drag an Extension into your dashboard from the Objects section on the bottom left. You will be prompted to select your Tableau Extension file.
- Make sure the correct row is selected in your Extension when you clicking a point in your graph.
If not, repeat step the first section of this tutorial.
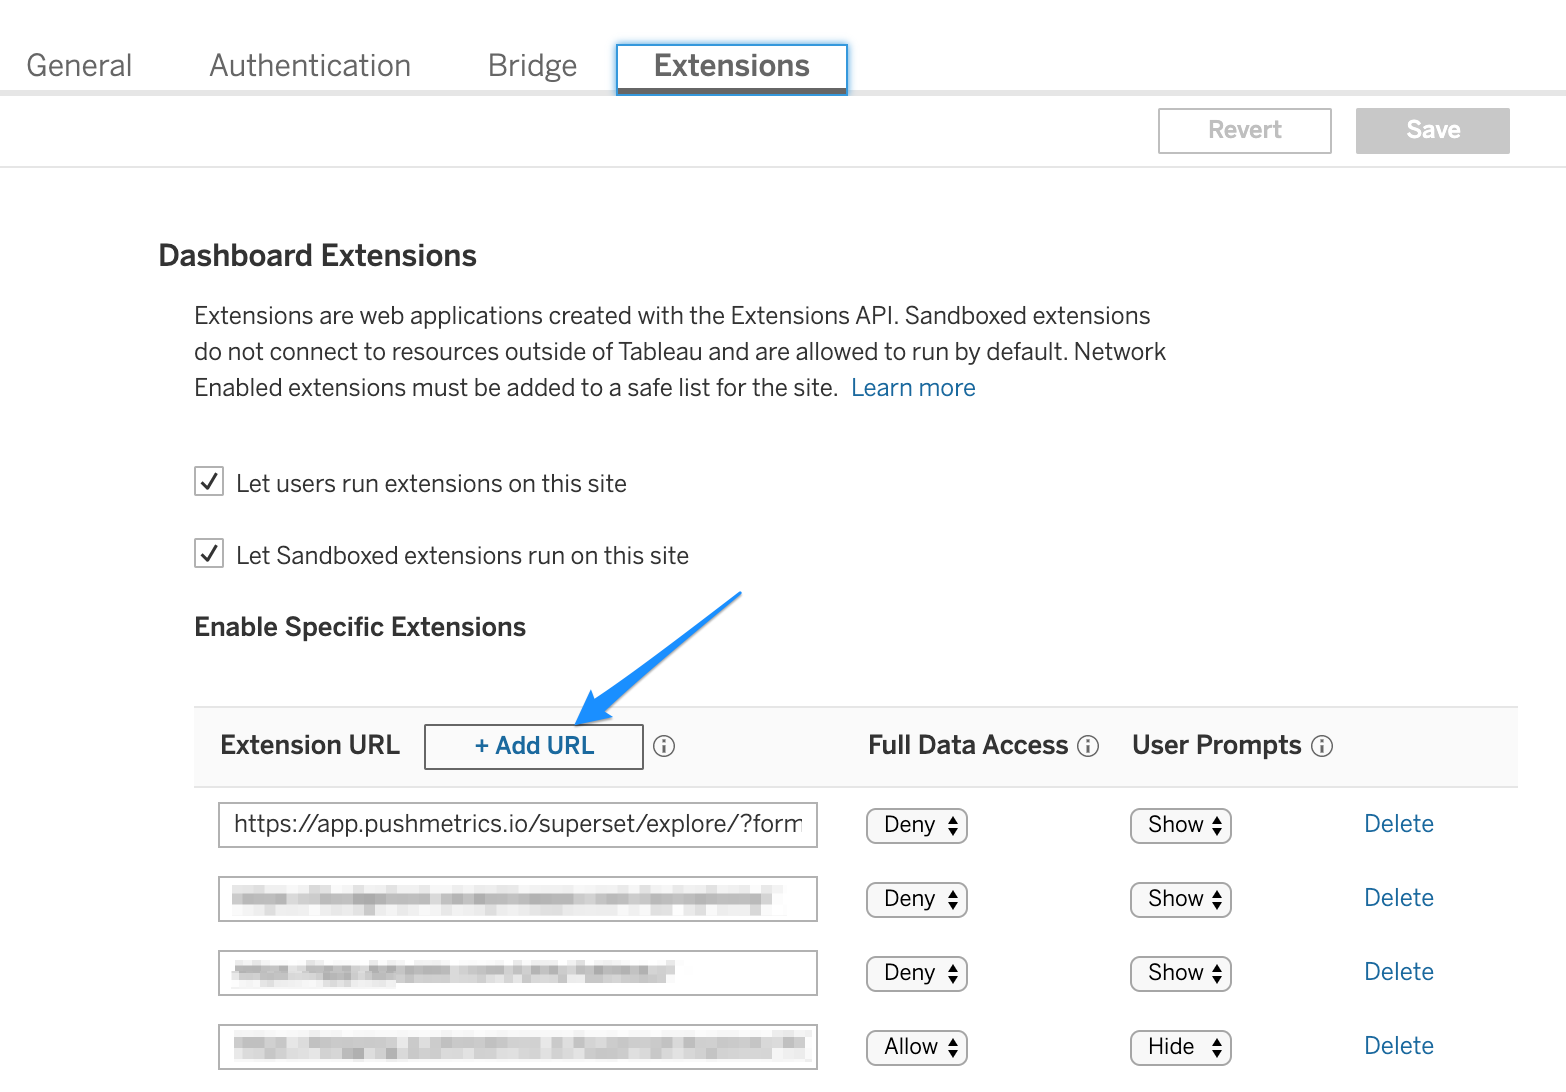
3) Add the Extension URL
In order for the extension to access PushMetrics it must be whitelisted in the Tableau Settings.
Go to Settings > Extension > (+) Add URL,
and enter the following same URL as above minus the & part!
For the above example that would result in the following URL:
https://app.pushmetrics.io/superset/explore/
?form_data=%7B%22slice_id%22%3A%20799%7Dstandalone=true
The URL must be the same as in the .trex file, minus the & !