If you are using Tableau as your Data, you should skip this step.
This tutorial makes use of the Demo Dataset named Car Sales. If you would like to follow along, you can import the Demo Data via Settings > Data Connections > + Create.
We will create a Dashboard in Superset, consisting of a Line Chart and a Table.
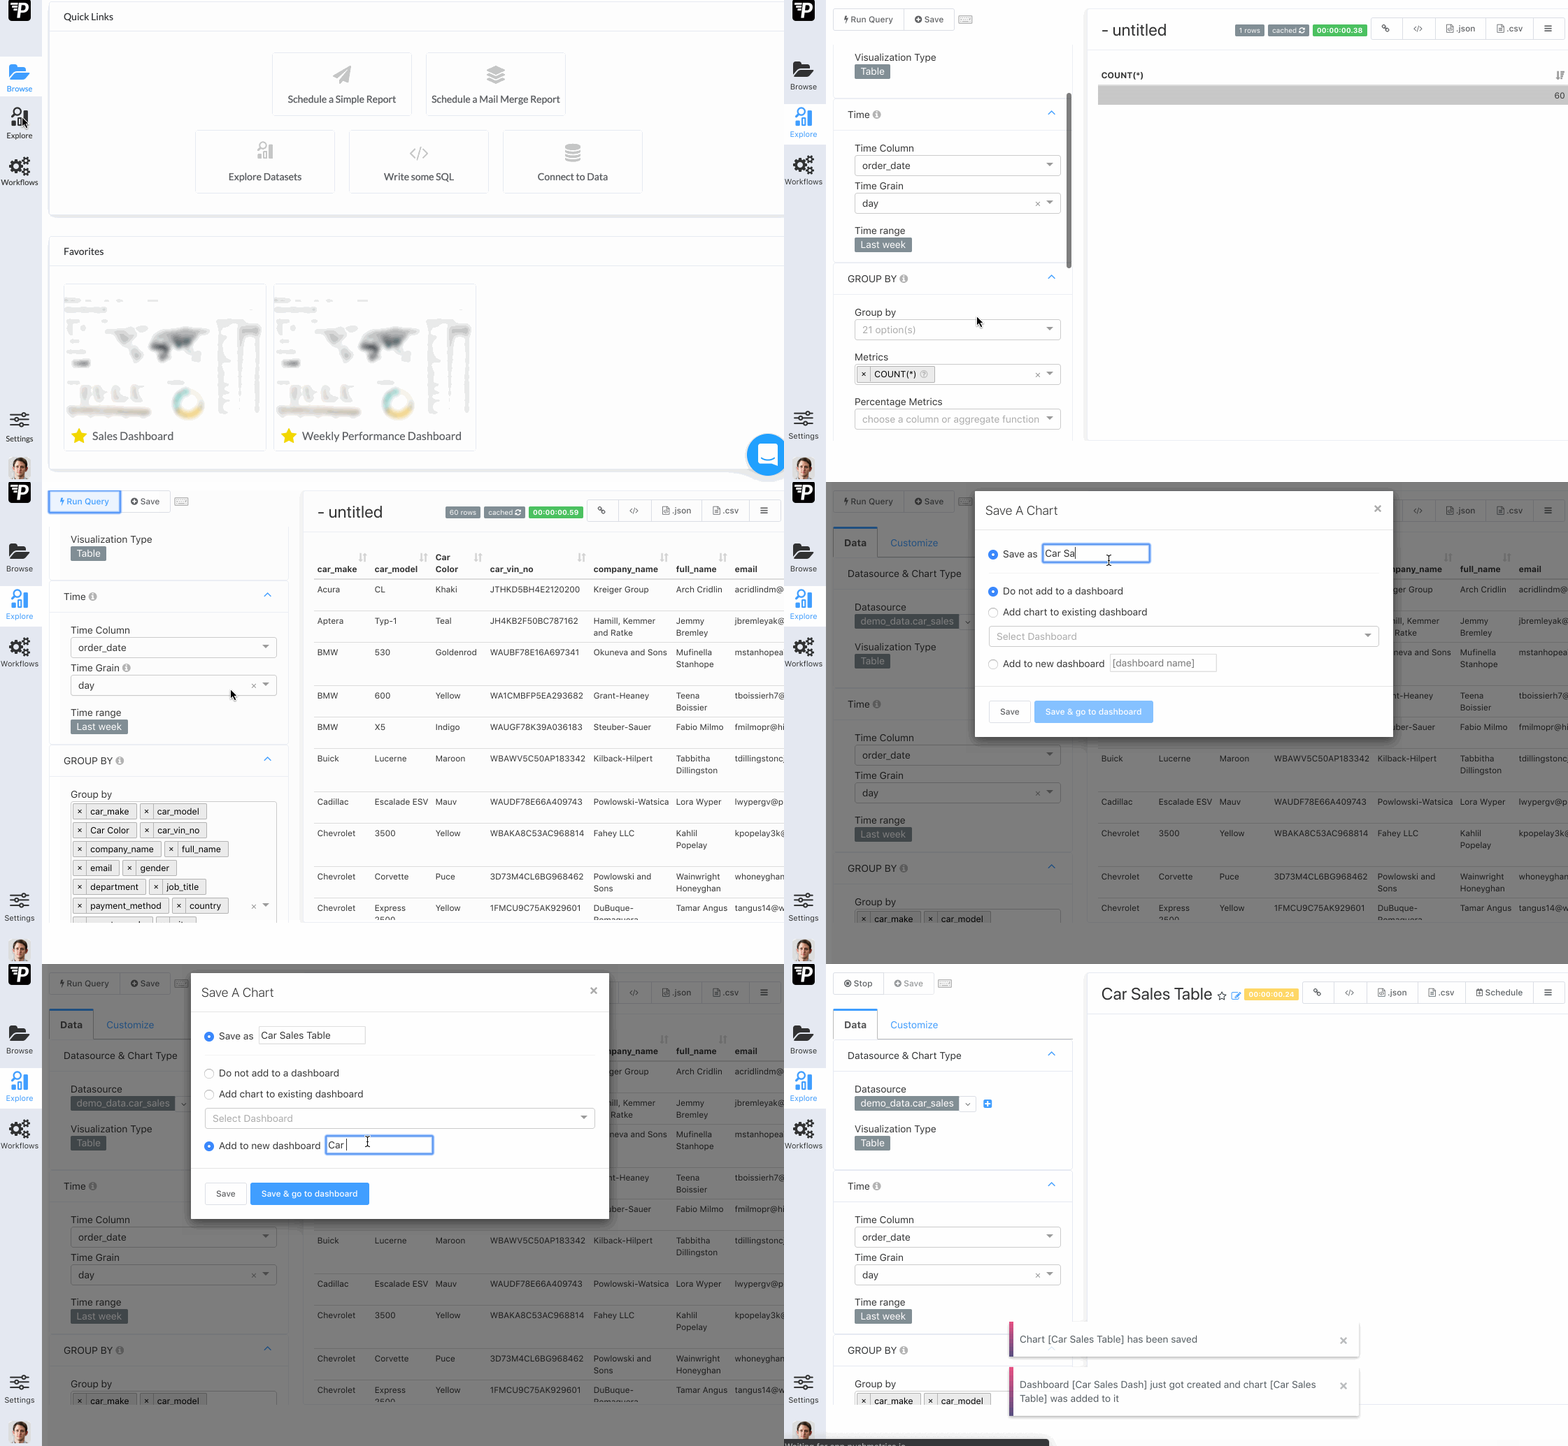
1. Choose your Data in the Explore Section or find it using the search bar.
2. Go to Group by and Select All columns to display the entire Dataset.
3. Run Query
4. Click Save, give your Chart a name, choose to save it in a new Dashboard, and give that a name too.

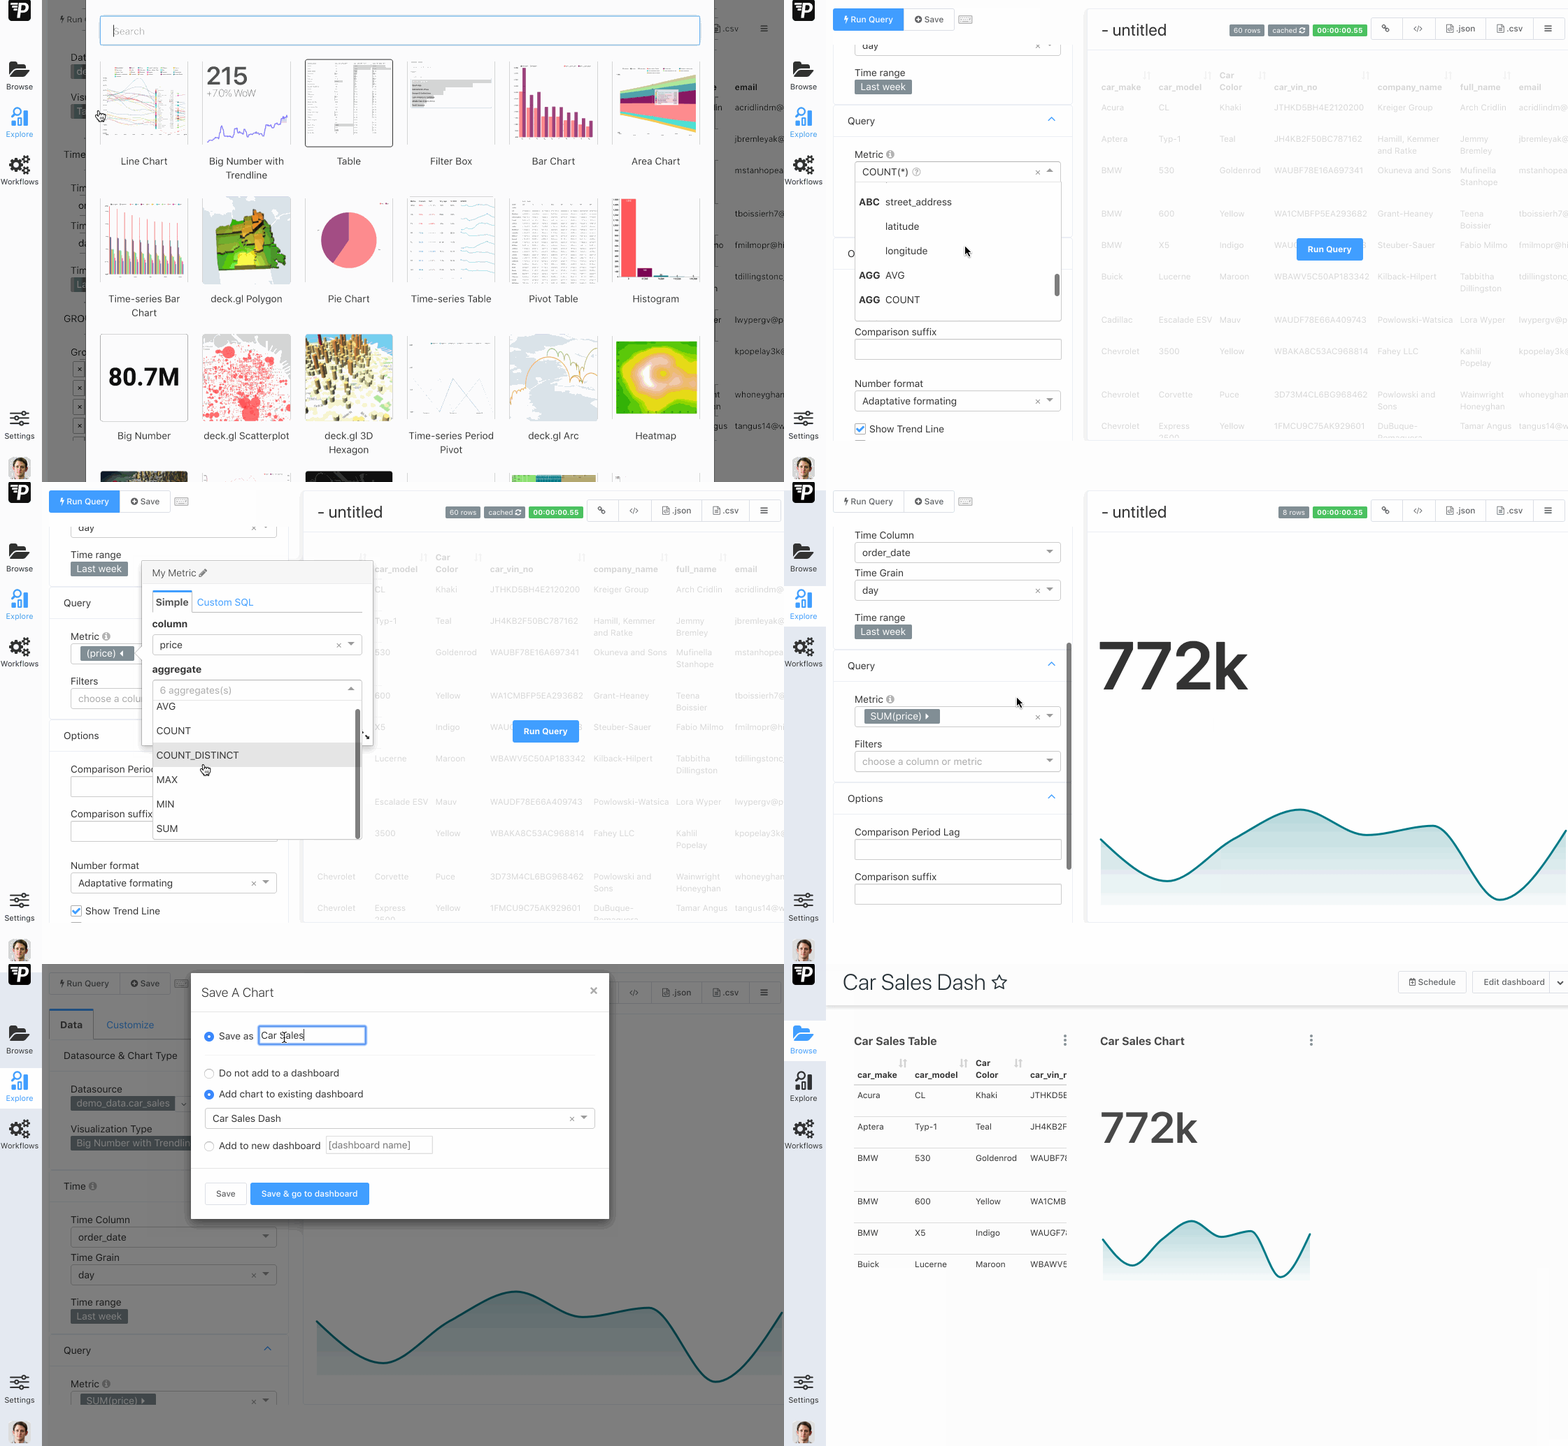
5. Click the Visualisation Type (Table), and choose the Line Chart.
6. Delete all items from the Group by section.
7. Choose price as the Metrics and SUM as the aggregate.
8. Run Query
9. Click Save, give your Chart a name, choose to save it in an existing Dashboard.
10. Save and go to Dashboard.

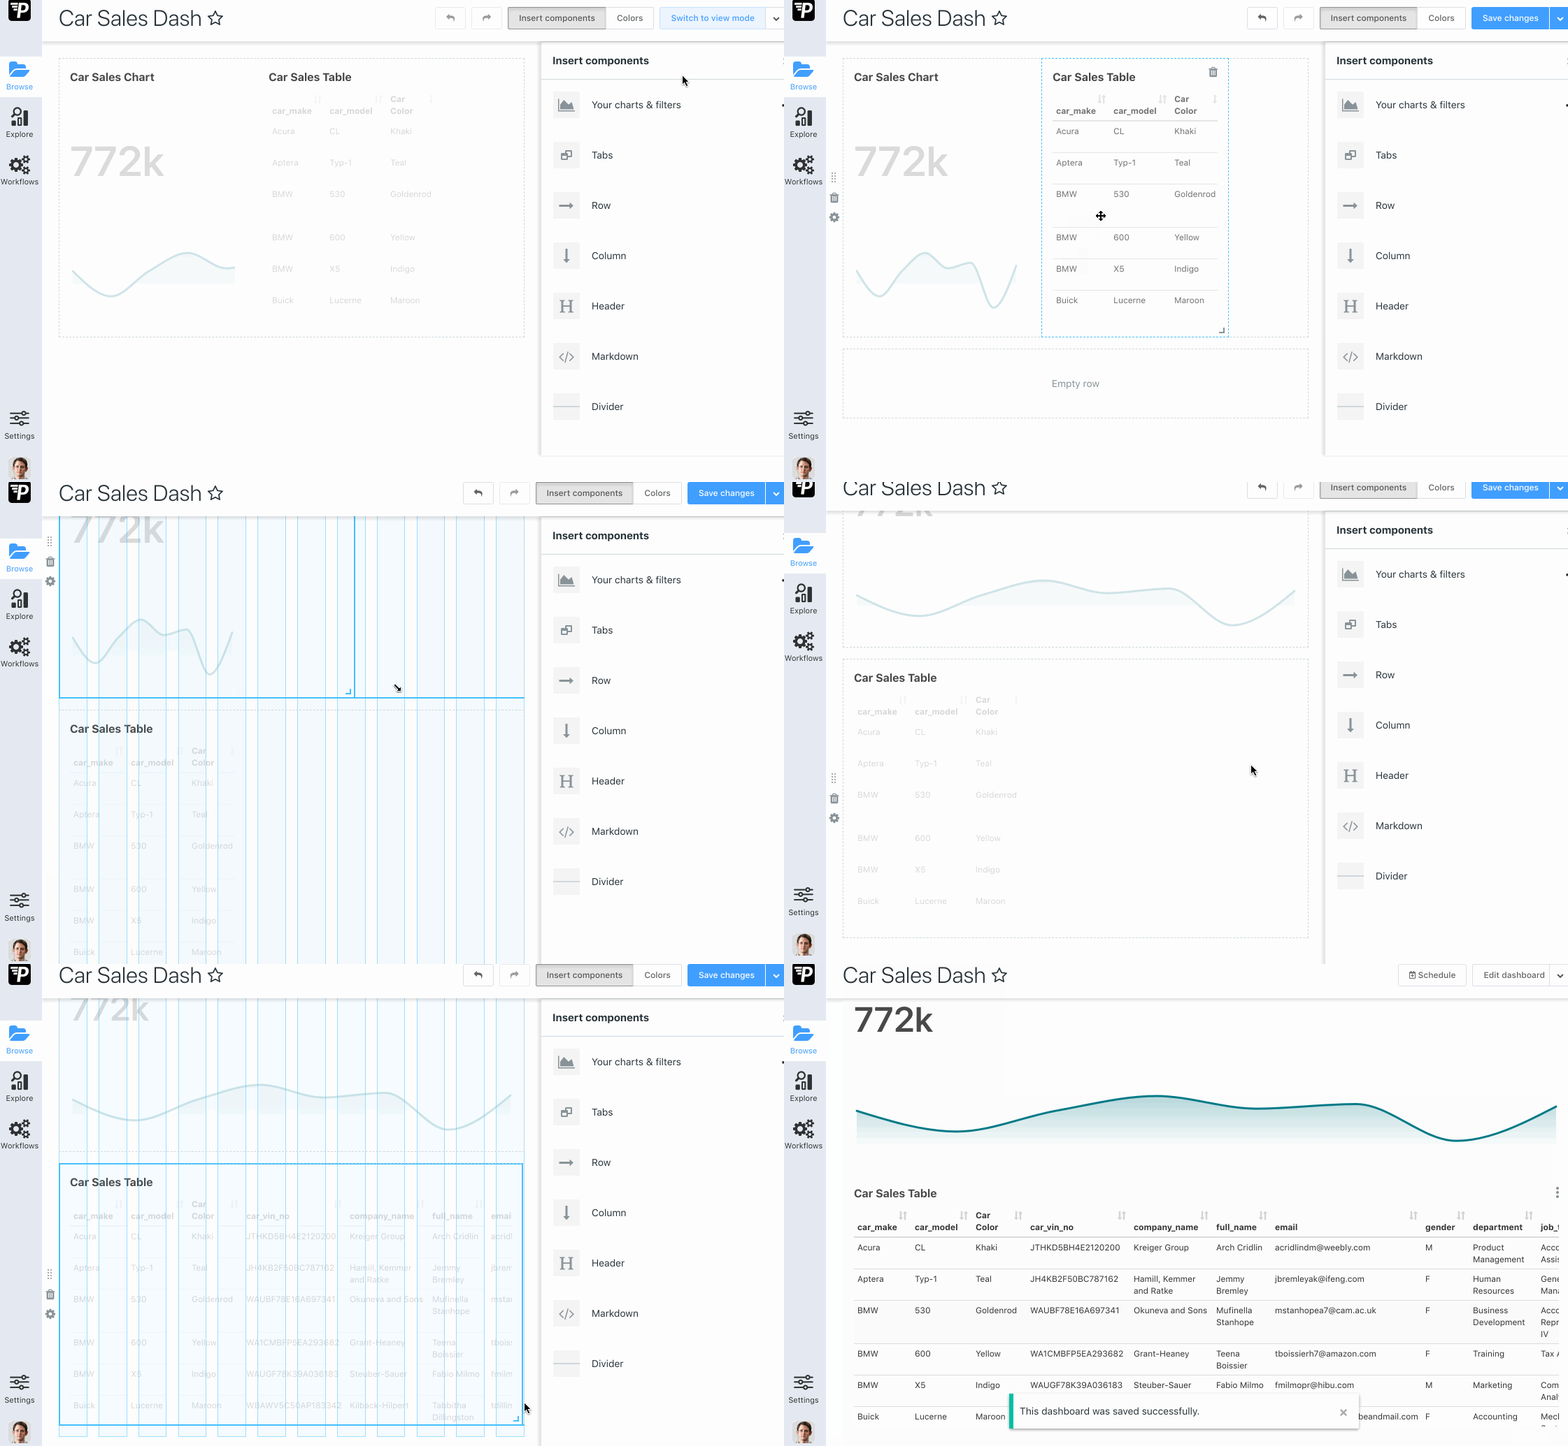
11. Arrange your Dashboard.

Done. In the next Section, we will schedule this Dashboard to send weekly.
