A Dashboard is created whenever you decide to save one of your charts in a Dashboard, as explained here. You will find your Dashboards in the Browse section along with your Charts and and Tableau Views.
Editing a dashboard in Superset is a very intuitive process. To add an element simply drag it from the side-bar into the Dashboard. An element may be a chart or one of the visual components, like columns, rows, and dividers.
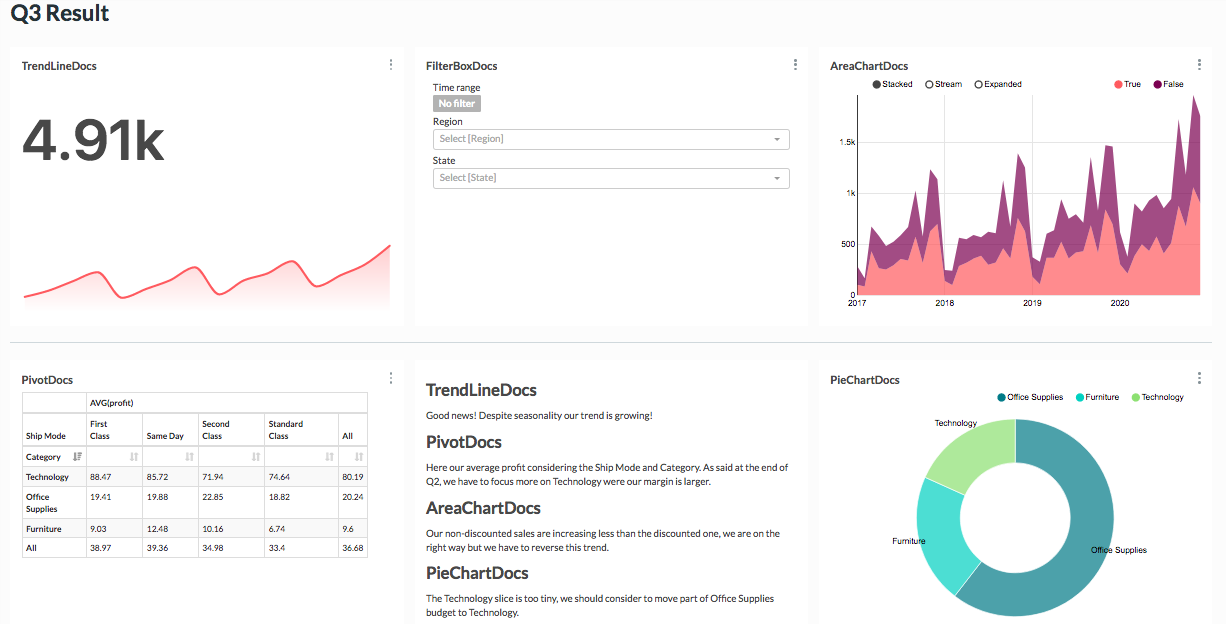
A final dashboard might look like this: