A Workflow is an automated process that distributes your data visualisations using settings that you pre-determine. Your charts & figures are already dynamic by nature, unless created using static data. Workflows take these reports, or filtered views of them, and send them to whom you choose at at a given interval.
There are two types of Workflows: Simple Reports and Mail Merge Reports.
The Table below displays their features and what their simple yet important difference is.
| Content | Simple | Mail Merge | Description |
|---|---|---|---|
| Loading Parameters | Load JSON or SQL Parameters for individual Reports | ||
| Attachments | Attach Charts, Dashboards, Tableau views | ||
| Message Decoration | No JSON/SQL | Access parameters in your Message | |
| Scheduling & Triggers | When and how often does it send? + SQL Conditions | ||
| Destination | Email, Slack, Webhook, SFTP, S3 Buckets | ||
| Sharing Settings | Permissions on accessing your reports | ||
| Additional Options | Summary reports |
Simple Report
The Simple Report is best used when you have simple data or charts, to be shared in a slack channel, or as a file per email. Once, or at an interval.
When set-up correctly, the report will automatically pull the latest data from your servers and then send them to your team members, your entire company, or your clients and costumers.
A Typical example would be a Report of last weeks sales, displayed in a Chart or Table, sent every Monday morning to the sales team.
The same message and content for everyone.
Mail Merge Report
The Mail Merge Report is essentially a more powerful version of Workflow that allows a much higher degree of customization.
Parameters loaded in JSON or SQL make it possible to send filtered versions of a report depending on who is being addressed.
One and the same Dashboard can be used to show different sets of data, depending on who is addressed.
Continuing with the Sales Report example from above; you could now set it up to send data relevant to segments of your team.
Like total sales Worldwide to the whole team, and sub-charts of sales per region only to the team of that respective region.
All in one Workflow!
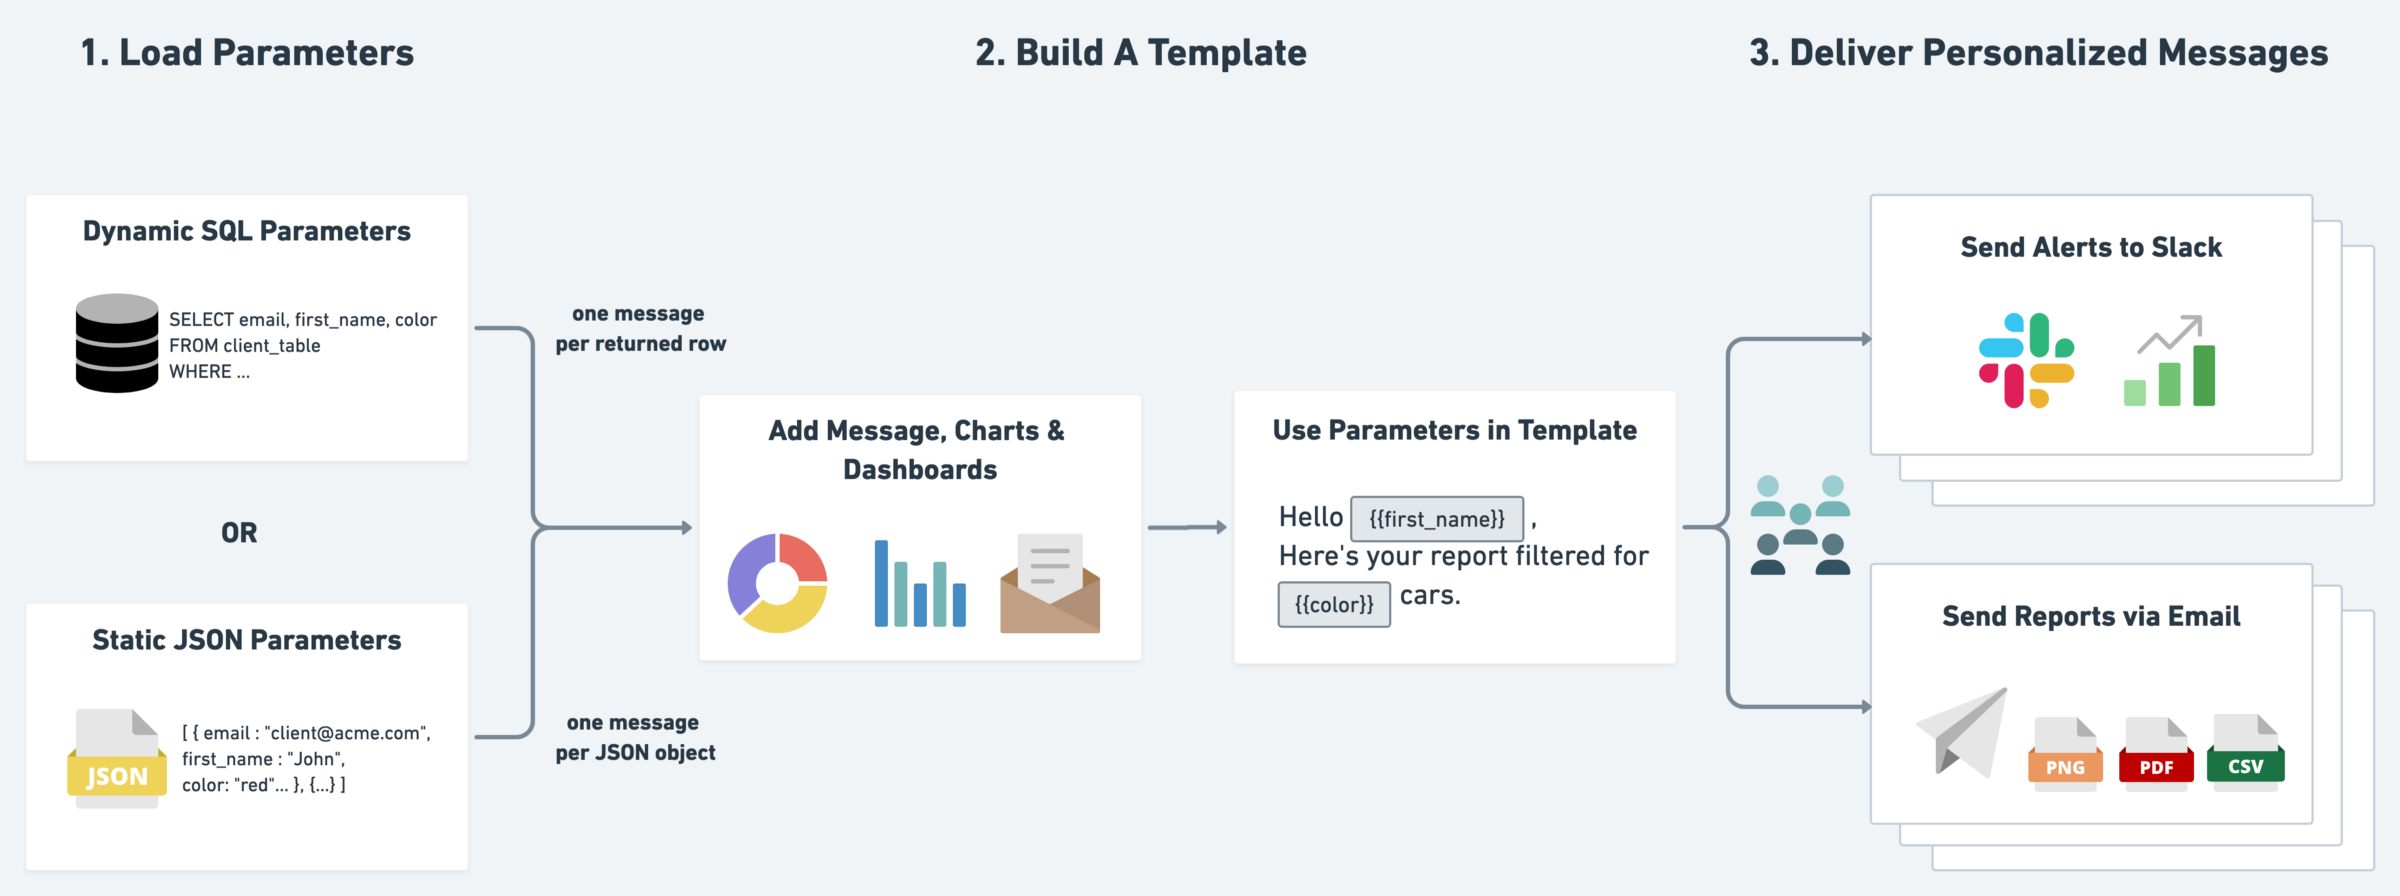
How does the Mail Merge Report work?
You combine a list of parameters (such as email addresses, names, regions, KPIs, etc.) with a report template (containing message, recipients, charts, dashboards, CSV exports, etc.). The list of parameters can be provided via a static JSON array, or it can be loaded dynamically via a SQL query. For each JSON object; or for each row returned by the SQL query, one message is being sent.
Navigation
-
In All Workflows, by default, your Reports are sorted by their date of creation.
You’ll find that you can sort them by their activity status, alphabetically, when they’re next to be run, or which of them ran most recently.
By clicking the Edit button on the right hand side you will find the options to Edit, Duplicate, and Delete - as well as the option to open a Report in a new tab of you Browser.
Selecting more than one of your Reports will present you with the same Options. Bulk editing is not an option.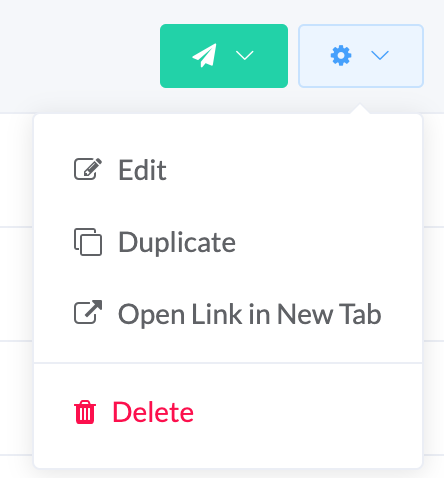
-
Recent Activity quite literally shows you your active reports, sorted by ‘most recently triggered’.
You will find the options to filter by Report Name, Status, Running User, and select a Time Frame.
Only one parameter per filter at a time. Hover above a parameter to display the x, and click it to remove the filter.
Current Limitations:
- Please note that we currently limit mail merge reports to 500 objects/rows by default, i.e. max. 500 messages will be generated with one mail merge report. Contact us if you need more.