To create an editable table you will have to access your dataset in Superset using the “Editable Table” or “Singe Record Editable Table” Charts. When creating the chart you will have the usual options, selecting rows, order, and filters. Additionally you will need to configure the editing options, and define parameters that enable embedding into Tableau.
The Single Record Editable Table limits the view to a single row. It is designed to display values of a single row, embedded in a Tableau Dashboard, as selected in a said Dashboard.
Creating an Editable Table Chart
- Set up your view. Choose Columns that you would like to view or edit. Apply Order and Filters as needed. If you are not familiar with setting up a chart in Superset. Have a look here.
- Visually, the big difference in this table is the editing style. There are three different, equally powerful styles of editing.
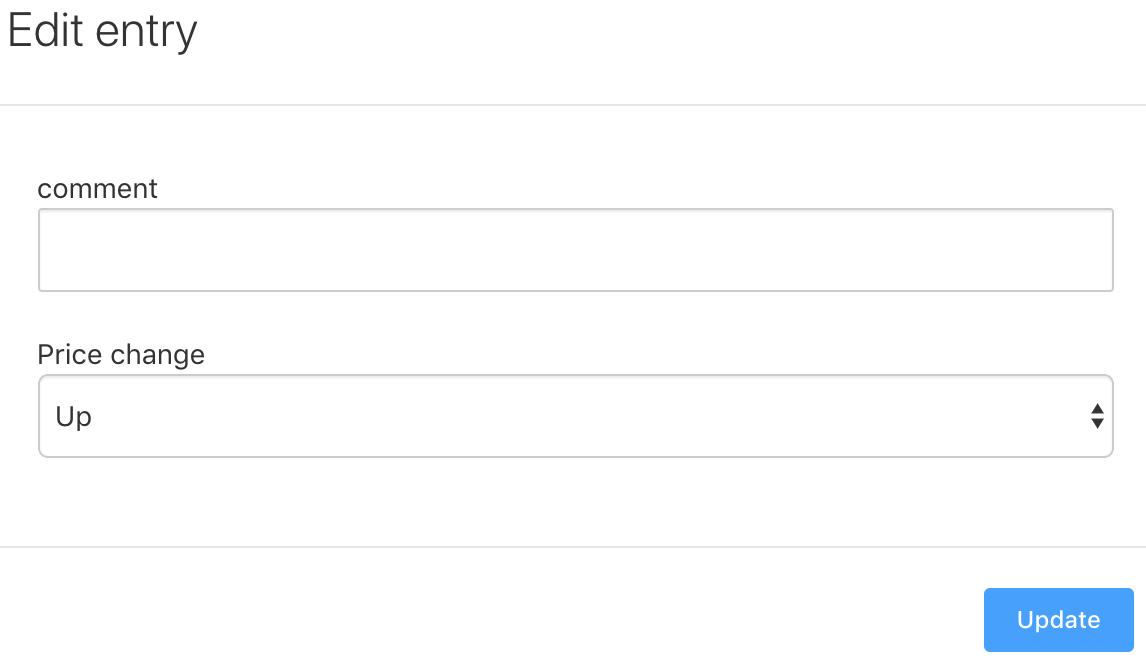
- Full Row Editing:
Click the row you wish to edit and hit the edit button. A pop-up will show you the editable content of said row and the option to edit values as defined.
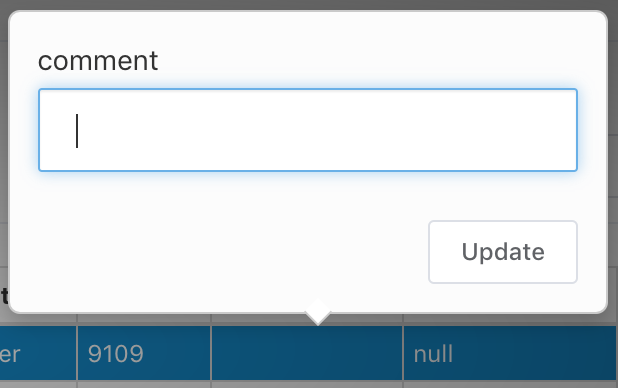
- Bubble Editing:
When clicking an editable cell, a small pop-up will appear above that cell and allow you to put in a new value.
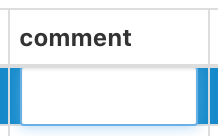
- Inline Editing:
Clicking an editable cell, changes that cell into a text field. Handle with care.
- Full Row Editing:
Click the row you wish to edit and hit the edit button. A pop-up will show you the editable content of said row and the option to edit values as defined.
Primary Key
Your Primary key is what identifies the row you make changes to. If you choose a Primary Key that identifies more than one row, your changes will apply to all of them. An easy way to make sure your Primary Key applies to the correct content is by using the same values as filters, thus making sure the correct rows are returned.
In this example a combination of Date and Segment is used to uniquely identify the row. Note the difference when using a Primary Key that identifies more than one row.
An incorrect Primary Key can result in unwanted changes to your data.
Configuring the Editing Form
This is where you choose what columns are editable, and if so, what the options of editing are.
- Choose a column you would like to make editable.
- The Type defines what sort of cell the outcome of your edit will be. These are your choices:
- Text: A simple text field.
- Password: A text field with hidden characters.
- Textarea: A multi-line text field.
- Select: A Drop-down menu with its options defined in the default field, separated by “;”.
- Checkbox: A Checkbox with its options defined in the default field, separated by “;”.
- Radio: Same as Checkbox, where only one choice is allowed.
- Date: Clicking a date cell opens a calendar to pick a date from. The format is defined in the “Table Timestamp Format” section above.
- Datetime: Same as Date, including time.
- Readonly: Shows cell in editor, but doesn’t allow editing. This function allows you to auto-fill a cell with a default value while ensuring that users can see but not edit.
- Hidden: Hides Column. Similar to read-only but not showing cell when editing.
- Choose a Label: Label for your values, as alternative display for the row name.
(E.g: Row name isrow_n; Label could beRow Number) - Default: Choose a default value for the field. Default Values are especially important you want standard values to be assigned, like “last_edited”, when creating rows, or when the editing type relies on a selection.
- Tick whether or not the default value is to be used when cell is left empty.
- Tick whether or not the cell may be left empty.
Lastly, tick to activate the Create, Edit, and Delete buttons:
- Create: The Create button will create a new row in your Table, using default values as defined.
- Edit: the Edit button is only necessary for the “Full Row” editing-style, where a pop-up appears when a row is selected and the button is clicked.
- Delete: The delete button removes the selected row.
Embedding Tableau
When embedding your Table into Tableau for live editing, you will want your Table to select the right row when clicking a data point in your Tableau graph. In order for this selection to happen, Tableau needs to pass parameters to your Table. You may use a combination of rows, as in the example above, or a single parameter. Ideally, you use the same parameters as you are using in the Primary Key. Most tables have a column for a unique row identifier. It is safest for both, selection and editing, to use that identifier as Primary Key and Tableau Parameters.
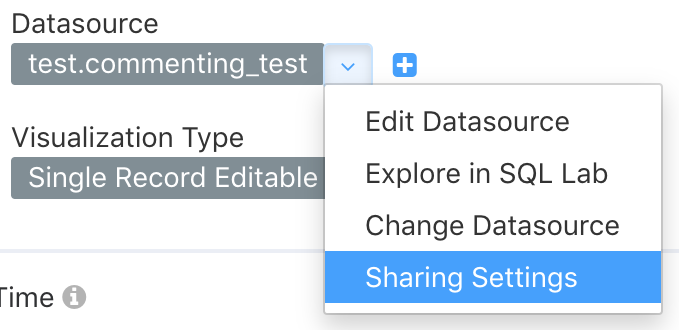
Sharing Settings
The sharing settings are located in the Datasource settings:
To give editing permission to a PushMetrics user that isn’t Owner or Admin, they must be added to a group that you grant permission to. It is also possible to set the sharing settings Public, allowing all PushMetrics users to make changes to the datasource, using the Editable Table.