Alerting is one of the most important ways of condensing data down to what is necessary. Receive a Report or a Message whenever a condition is met in your Tableau or SQL Server.
Alerting can be set up in 2 ways:
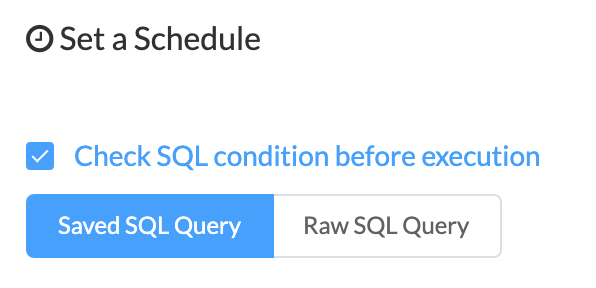
1. Check SQL Condtition
The simplest way to set up an Alert is by using an existing SQL database and write a query to check for a condition to be met in your data. The ‘Check SQL Condition’-option is in the top part of the Schedule section in the Workflows. Check the box and choose if you want to write a Query or use a saved one:
You will still have to set up the interval at which you want to check this condition and prepare your Report as usual. The Report will only be triggered if the SQL condition is met.
A simple example for a condition could be that Sales are at a certain level, such that:
SELECT CASE WHEN sales > 100000 THEN 'True' ELSE 'False' END
FROM demo_data.store_oders
WHERE order_date > current_date - 10
This SQL Statement returns ‘True’ when sales are bigger than 100k in the last 10 Days, thus triggering the Report.
2. Create Table in Tableau
To create a Report triggered by a condition using only Tableau, you can use PushMetrics MailMerge logic in combination with a conditional Table in your Tableau View. All you have to do is create a single value sheet in your View and filter it depending on the condition you would like to use to filter your Report. As in the example above, let’s look at total sales over the past 10 days. First you will need a calculated field that expresses the measure you’re looking at. Here is how I created measure for this example:
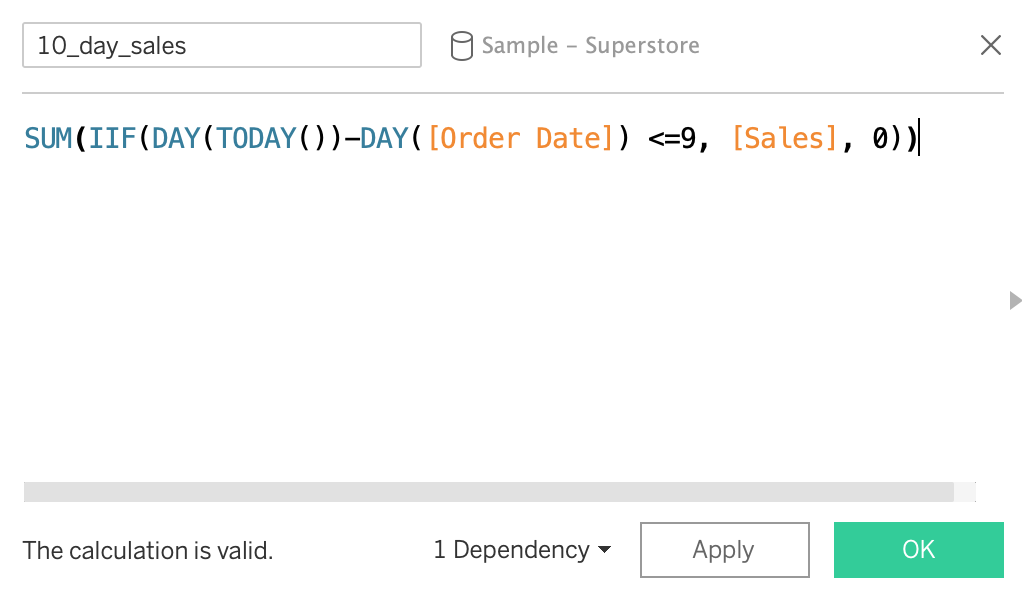
Once your measure exist, drag it onto an empty sheet, so that it is the only thing displayed in it. Now drag that same calculated field (in my case it is called ‘10_days_sales’) onto the filter field. This is where you decide the condition under which the value will be displayed. For this case I am choosing 2.5Million.
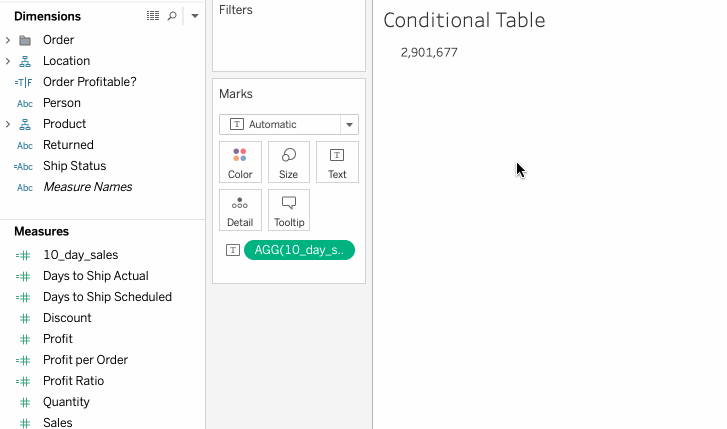
So whenever my sales in the last 10-day period rise above 2.5Million, there will be One Row in this table. Since we are using this table as our parameters in a Mail Merge Report, One Report will be sent out per row returned.
Note: You may also maintain an entire Address list in Tableau and apply that same filter to the list. Simply use {{ column_name }} in the Recipient bar, and a report will be sent to each person in the list.
Now, when creating a Mail Merge Report, choose your Table in the Load Parameters section. Whenever this report runs, it will send a report for each row in the table, meaning none when the condition isn’t fullfilled. Set up the rest of your Workflow as usual: Create Attachments, choose recipients, interval etc.
Finally, lean back and don’t worry about this KPI until you get a PushMetrics report about it.